2 Quick Start
Normalize first. Test DEGs later.
normpatch estimates normalization factors from RNA-seq count data before downstream DEG analysis. The example below shows a standard workflow: load a raw count matrix, define the experimental groups, estimate normalization factors, convert the result to an edgeR object, and fit an edgeR quasi-likelihood model for DEG detection.
library(edgeR)
library(normpatch)

# gene expression
count_data <- read.table("data/ath.E-MTAB-4391.txt",
                         header = TRUE, sep = "\t", row.names = 1)
keep <- rowSums(cpm(count_data) > 5) > (ncol(count_data) / 2)
count_data <- as.matrix(count_data[keep, , drop = FALSE])

# experimental groups
group <- sapply(strsplit(colnames(count_data), "_"), "[", 1)
exp_design <- data.frame(group = group)

# data preparation
x <- newSeqCountData(count_data, exp_design = exp_design)

# calculate normalization factors
x <- calc_nf(x)

# convert to DGEList object for edgeR
d <- as_DGEList(x)

# statistical test
design <- model.matrix(~ group, data = x@exp_design)
d <- estimateDisp(d, design)
fit <- glmQLFit(d, design)
qlf <- glmQLFTest(fit, coef = 2)

test_stats <- topTags(qlf, n = nrow(d$counts), sort.by = "none")$table## logFC logCPM F PValue FDR
## AT1G01010 0.11660865 4.900775 2.93104328 0.1172343516 0.307612744
## AT1G01020 0.04573917 4.450448 0.37448439 0.5540350724 0.744167464
## AT1G01040 0.00838787 5.767843 0.01806385 0.8957136213 0.952176428
## AT1G01050 -0.08956274 6.727516 1.49765070 0.2486922575 0.474723870
## AT1G01060 0.14418796 5.814221 5.95276916 0.0345363122 0.146819094
## AT1G01070 -0.42450045 4.969825 29.84581942 0.0002619819 0.005735274The output table contains one row per gene.
It reports the estimated log2 fold change (logFC),
average log2 counts per million (logCPM),
quasi-likelihood F-statistic (F),
raw p-value (PValue),
and adjusted p-value (FDR).
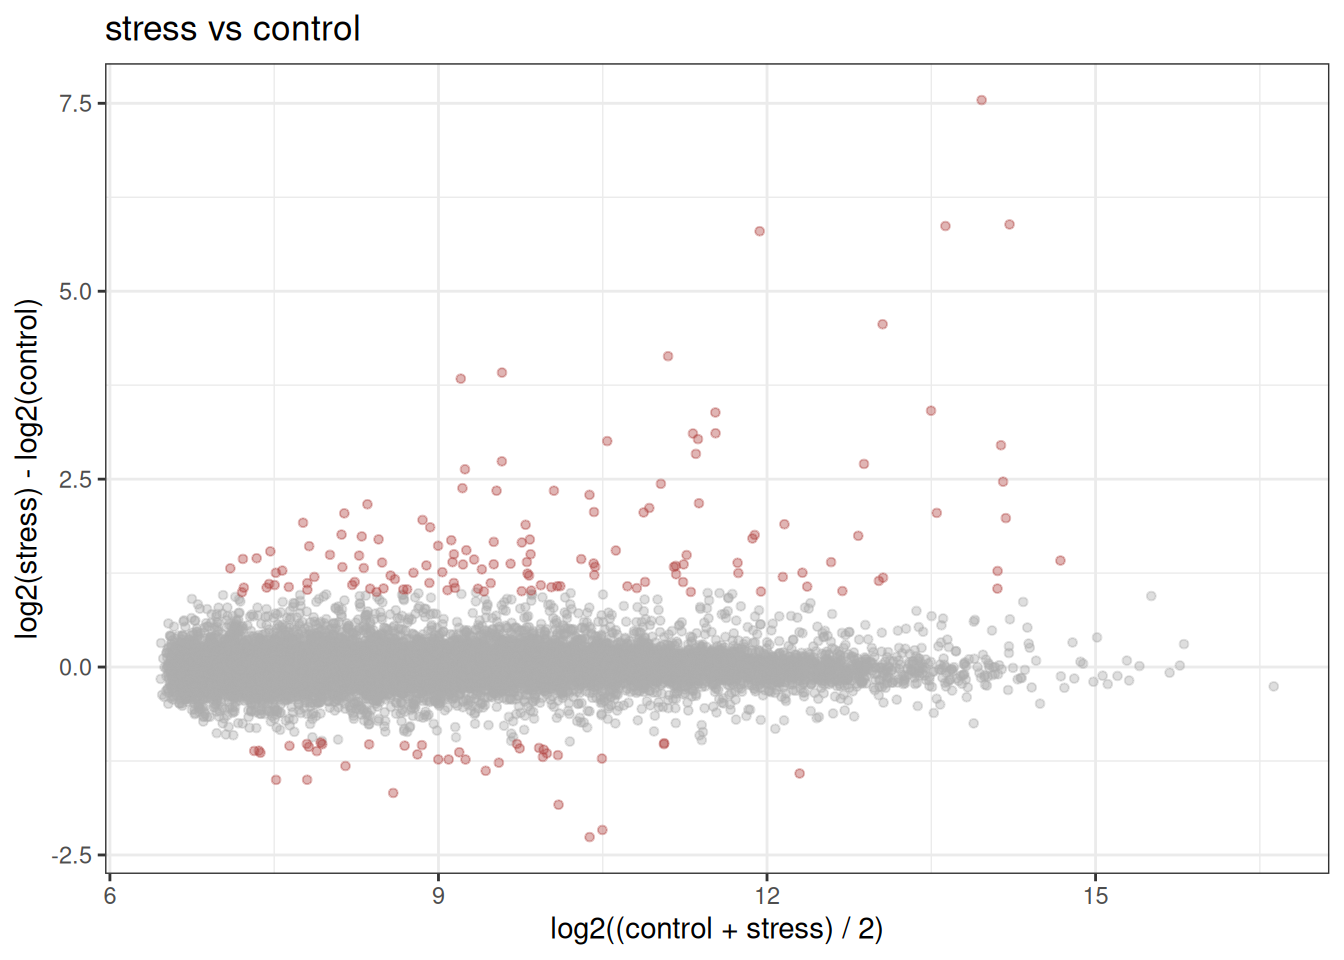
The detection results can be visualized with plot_ma() by assigning a color to each gene.
In this example, genes passing the selected FDR and fold change thresholds are highlighted.
is_deg <- (test_stats$FDR < 0.05) & (abs(test_stats$logFC) > 1)
gene_colors <- ifelse(is_deg, "#B24745", "#ADADAD")
plot_ma(x, col = gene_colors)